 Backtesting trading strategies on historical data
Reliable portfolio backtesting. Quant research level ![]()

hamster-bot/tester - Advanced tool for testing your trading systems on historical data.
- Run multiple strategy types across different timeframes simultaneously.
- All of this with a shared balance, to understand how strategies coexist in one wallet in real time.
- Tick data support. Simulates strategy behavior inside a candle as in live trading.
- No limits on input market data. Run tests for any historical period.
- Test complex custom logic that cannot be accurately tested with off-the-shelf solutions without workarounds.
- Backtests run on the same production code used by the bot in real time.
Implemented as a separate connector ![]() to an "exchange" (a Mock object replacing the real exchange). This makes it possible to test all previously written bot code. The bot thinks it is connected to a real exchange (places orders, receives balances and position info). The virtual exchange stub performs all calculations and generates the report.
to an "exchange" (a Mock object replacing the real exchange). This makes it possible to test all previously written bot code. The bot thinks it is connected to a real exchange (places orders, receives balances and position info). The virtual exchange stub performs all calculations and generates the report.
 Market data for testing
Crypto exchanges publicly share historical market data. Examples: public.bybit.com, data.binance.vision, public.bitmex.com.
The tester downloads the required trade data range and builds candles for the bot. Before the test starts, the tester also downloads extra data to warm up all TA indicators used by the strategy.
Data is saved to ![]() folder
folder tester/data/{exchange}/{symbol}. You can also put your own data in CSV format into this folder.
There is a run_download_data.bat file in the bot folder. It launches the bot with the --download-data flag, and in this mode the tester simply downloads all required data.
Automatic market data download is implemented for spot and futures from exchanges: BYBIT, BINANCE, MEXC.
The exchange is configured in the settings file: settings.exchange.name = "binance"
 Tester behavior
From the bot’s perspective, the tester is just another exchange. The bot connects to it and starts receiving candles, placing orders, etc. Meanwhile, the tester simply emulates real exchange behavior.
Balance is shared across all strategies. Behavior is similar to BYBIT/BINANCE futures with cross margin. The bot can request Wallet or Margin balance. Margin balance is calculated including all open positions and their unrealized PnL.
Real price behavior. When the bot requests the current unfinished candle, the tester returns trade prices from tick data (until market data inside the candle is exhausted and then moves to the next candle). This allows strategies that depend on intrabar pricing (for example, slippage, trailing stops, etc.) to work correctly.
 Report
After testing is complete, a detailed HTML report is saved to ![]() folder
folder tester/report.
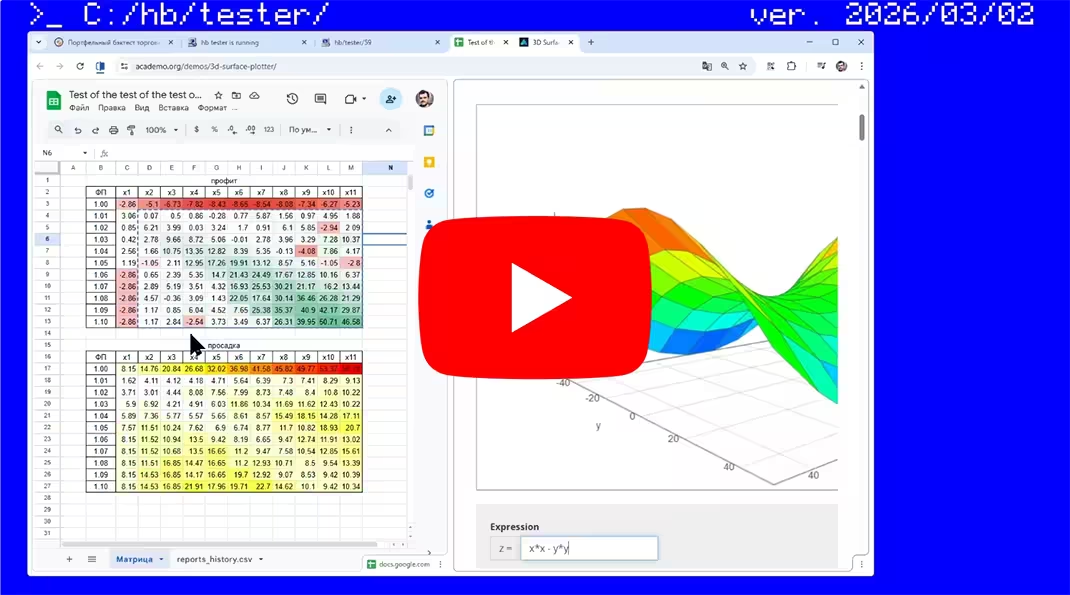
A record is also added to reports_history.csv with summary test info, so you can quickly find the best parameter combinations during optimization.
-
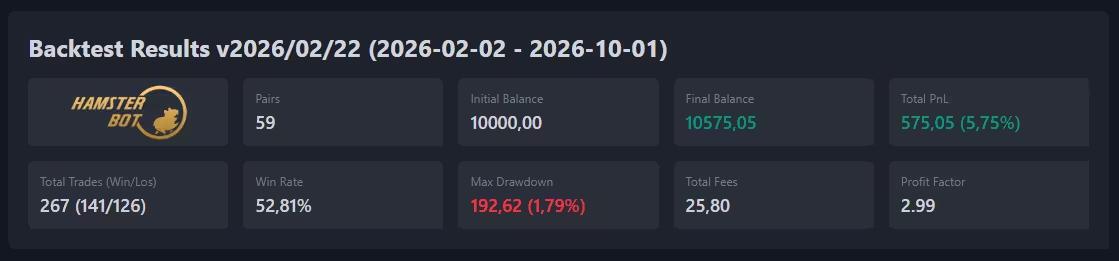
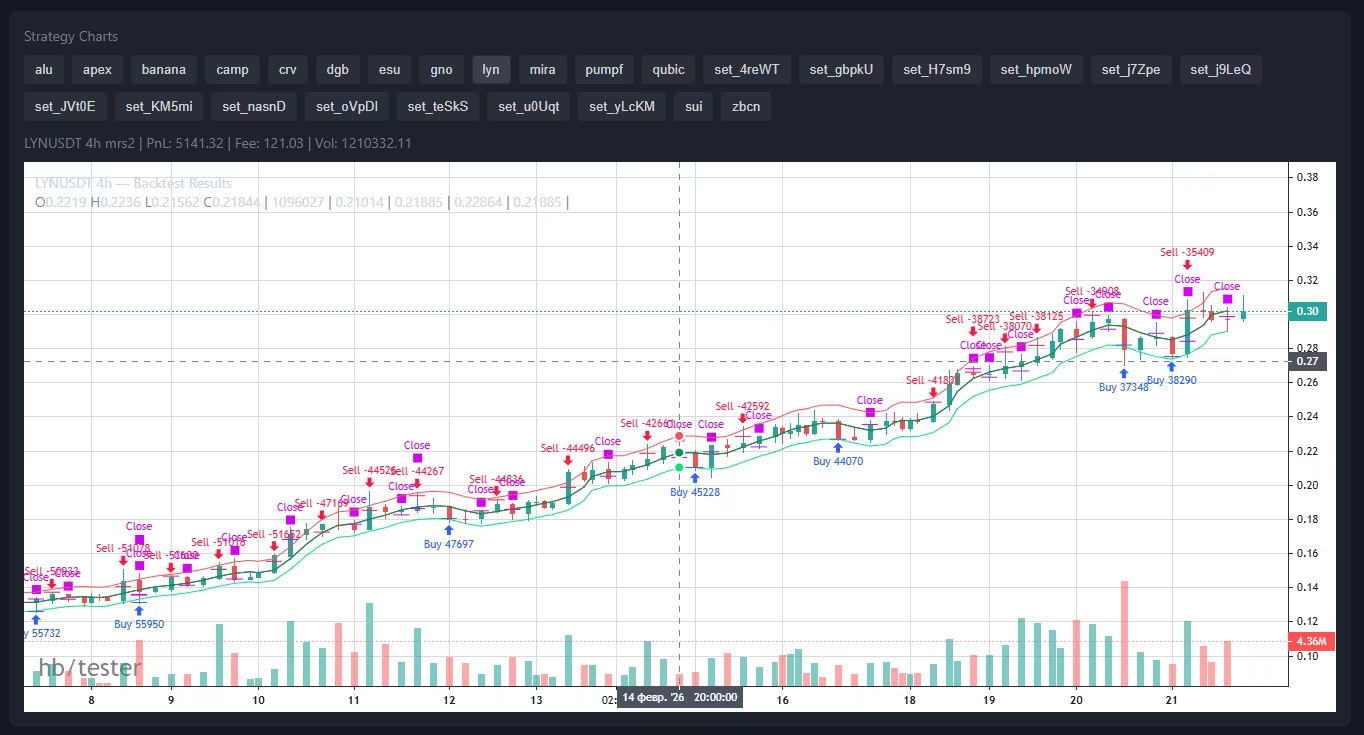
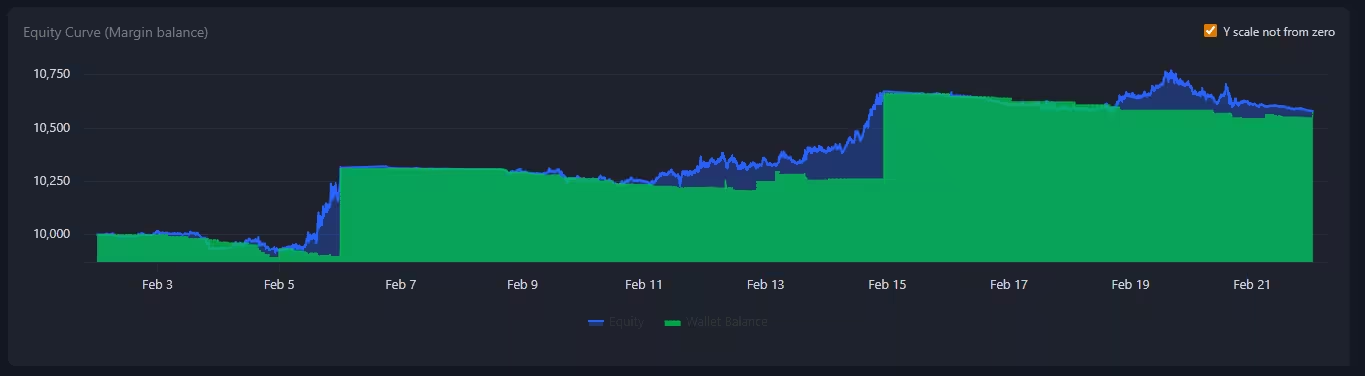
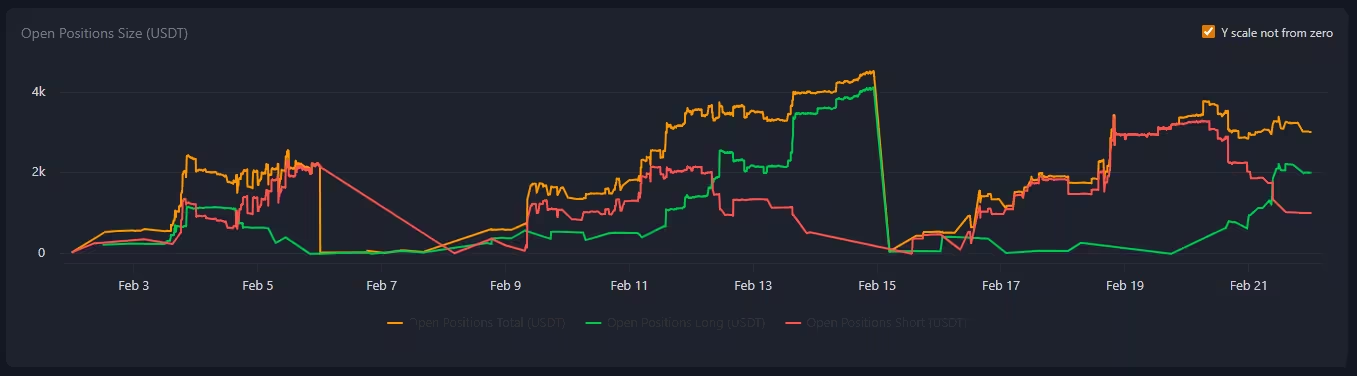
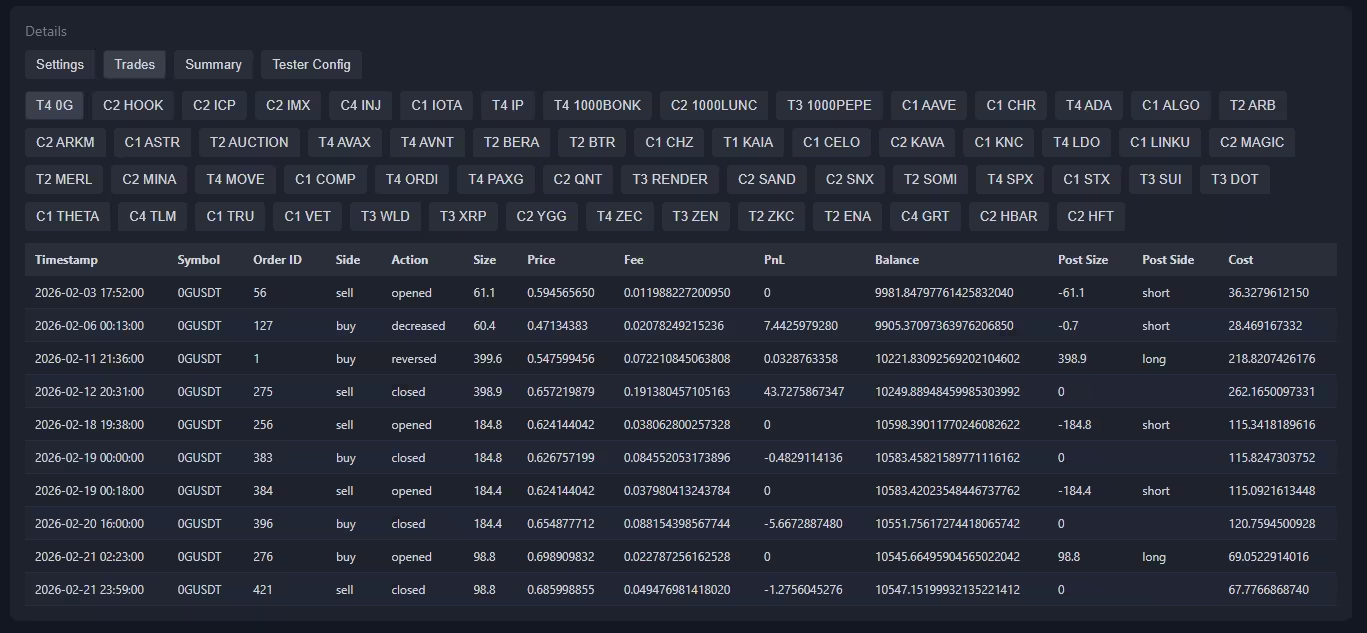
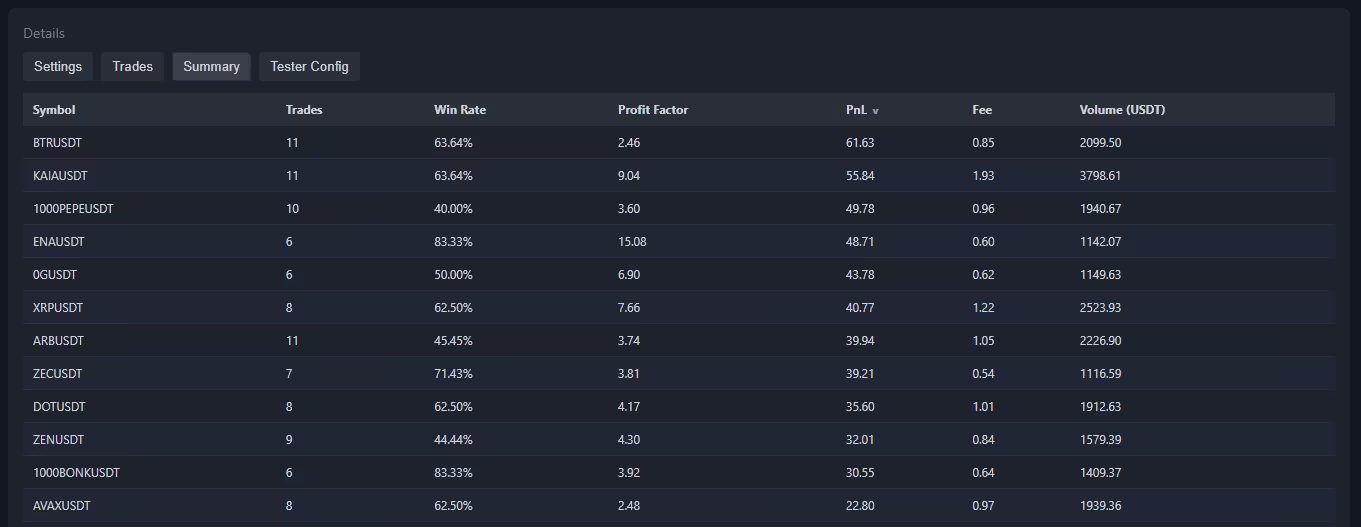
Report includes:
- Overall metrics for the entire trading system:
- Starting and ending balance
- Total profit/loss in USDT and %
- Maximum drawdown
- Number of trades
- Win rate
- Profit Factor
- Separate candlestick charts for each strategy, with trade markers and strategy TA visualization.
- Margin balance chart (including all open positions and unrealized PnL) and Wallet balance chart.
- Chart showing the total size of open positions in USDT (and a separate-axis % line showing the ratio of total open positions to Margin balance)
- Tables with full trade lists for each strategy.
- List of strategy settings and tester parameters.
- Summary information across all strategies. Trading volume and paid commissions.
 Tester parameters
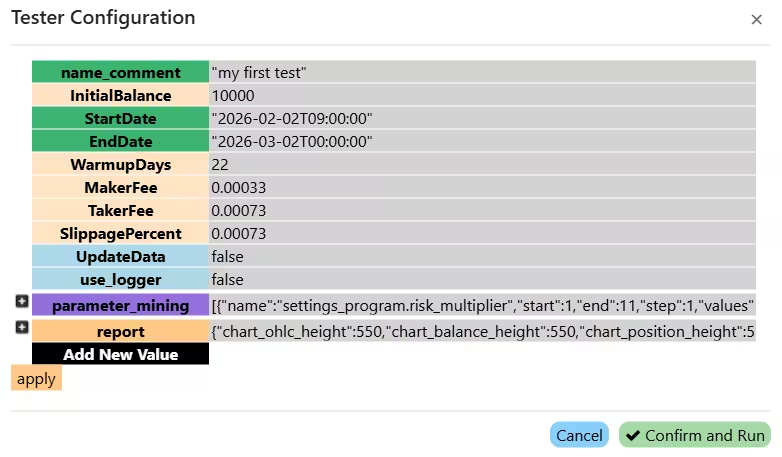
file: config_tester.json You can edit this file in any text editor.
name_comment - comment for the test, helps navigate reports
InitialBalance - initial balance for backtesting in USDT
StartDate - backtest start date in format 2026-02-03T00:00:00
EndDate - backtest end date in format 2026-02-13T00:00:00
WarmupDays - number of warmup days before the backtest starts
MakerFee - maker fee (0.0001 = 0.01%). Standard BYBIT fee: 0.00036 = 0.0360%. (guide to reduce fees significantly)
TakerFee - taker fee (0.0001 = 0.01%). Standard BYBIT rate: 0.001 = 0.1000%
SlippagePercent - slippage for market orders (0.0001 = 0.01%)
limit_order_volume_check - Volume check for correct limit order execution. The tester checks the volume on each tick and fills the order until it is complete or while volume is available
FundingRate - Funding rate value (0.00025)
FundingIntervalHours - Funding rate update interval in hours (8)
UpdateData - update data before backtesting (true/false)
use_logger - use logger. If disabled, backtesting runs faster (true/false)
max_parallel_runs - number of parallel tester runs during parameter optimization. If your hardware allows it, this can parallelize runs without slowing individual calculations.
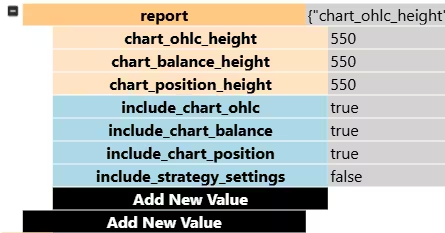
file: config_tester.json/report Report content settings:
chart_ohlc_height - OHLC chart height in pixels
chart_balance_height - balance chart height in pixels
chart_position_height - open position size chart height in pixels
include_chart_ohlc - include OHLC chart in report (true/false)
include_chart_balance - include balance chart in report (true/false)
include_chart_position - include open position size chart in report (true/false)
include_strategy_settings - include strategy settings in report (true/false)
 Optimizer (parameter sweep)
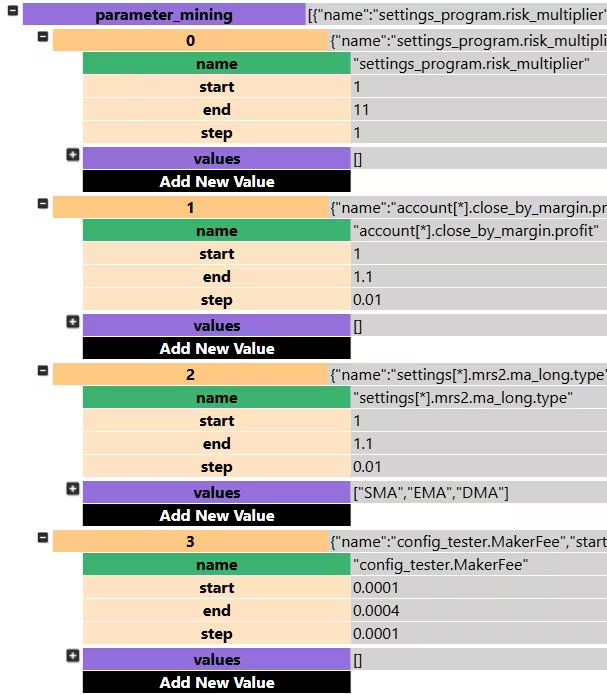
file: config_tester.json/parameter_mining Optimizer settings:
By default this is an empty list []. Fill it with entries like {"name":"parameter_name", "start": 1, "end": 10, "step": 0.1, "values": ["string1", "string2"]}
name - parameter name to optimize. You can target almost any bot setting. The bot has 4 config groups.
1) Strategy settings (.json files in settings_strategy). Here you configure symbol, timeframe, deposit handling, and strategy-specific options.
Example: settings[*].mrs2.ma_long.type - optimize type for strategy mrs2 entry order
2) Account API-key settings (.json files in settings_accounts). Here you configure account-wide margin take profit and max number of simultaneously open positions.
Example: account[*].close_by_margin.profit - optimize profit in close_by_margin
3) Global bot program settings (settings_program.json). Here you configure global options like risk multiplier.
Example: settings_program.risk_multiplier - optimize risk_multiplier
4) Global tester settings (config_tester.json). Here you can optimize tester parameters like commissions.
Example: config_tester.MakerFee - optimize MakerFee
start - start value
end - end value
step - increment step
values - list of string values to iterate. Used for string parameters.
For example, available MA types:
["SMA", "EMA", "GMA", "HARMONIC", "TEMA", "DEMA", "ZLEMA", "WMA", "VWMA", "RMA", "EHMA", "THMA", "HMA", "DMA", "ATR", "H", "L", "SMA_KALMAN", "EMA_KALMAN", "GMA_KALMAN", "HARMONIC_KALMAN", "TEMA_KALMAN", "DEMA_KALMAN", "ZLEMA_KALMAN", "WMA_KALMAN", "VWMA_KALMAN", "RMA_KALMAN", "EHMA_KALMAN", "THMA_KALMAN", "HMA_KALMAN", "DMA_KALMAN", "ATR_KALMAN", "H_KALMAN", "L_KALMAN"]
Price source options:
["open", "high", "low", "close", "hl2", "hlc3", "ohlc4", "hlcc4", "oc2"].
For pair sweeping — see Example 1.
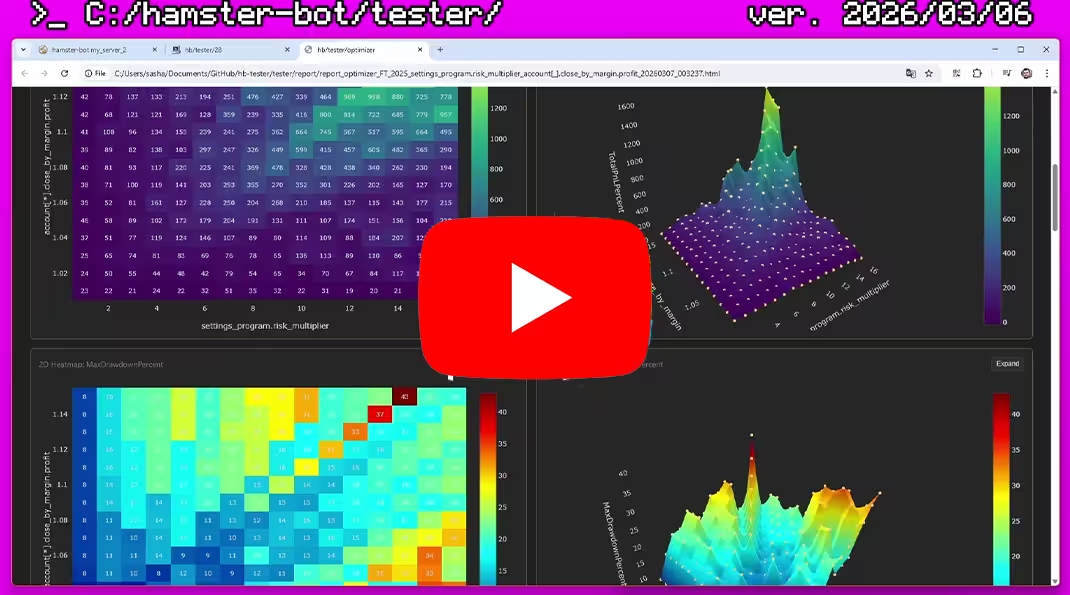
If you optimize two parameters in the range 1..10 with step 1, the tester will run 100 combinations (10 variants of the first parameter * 10 variants of the second). Results are saved as separate HTML reports and in the summary table (
reports_history.csv). This helps quickly find the best parameter combinations for your strategies.
Example 1: sweeping trading pairs
parameter_mining is a list ([]) where you add sweep objects separated by commas ([{}, {}]).
To sweep trading pairs, use the string field values; set numeric fields start/end/step to 1.0 (they are ignored when values is non-empty).
The parameter settings[*].basic.symbol will be applied to all settings files in the settings_strategy folder:
"parameter_mining": [
    {
        "name": "settings[*].basic.symbol",
        "start": 1.0,
        "end": 1.0,
        "step": 1.0,
        "values": [
            "1000BONKUSDT", "1000FLOKIUSDT", "1000LUNCUSDT",
            "1000NEIROCTOUSDT", "1000PEPEUSDT", "1000TAGUSDT",
            "4USDT", "AAVEUSDT", "ACHUSDT", "ADAUSDT"
        ]
    }
]
Result: the tester will run the backtest for each of the 10 pairs in sequence.
Example 2: sweeping multiple parameters simultaneously
Let's add a take-profit % sweep to the pair sweep — from 0% to 10% with step 0.5 (21 values total).
Number of combinations: 10 pairs × 21 values = 210 runs.
"parameter_mining": [
    {
        "name": "settings[*].basic.symbol",
        "start": 1.0,
        "end": 1.0,
        "step": 1.0,
        "values": [
            "1000BONKUSDT", "1000FLOKIUSDT", "1000LUNCUSDT",
            "1000NEIROCTOUSDT", "1000PEPEUSDT", "1000TAGUSDT",
            "4USDT", "AAVEUSDT", "ACHUSDT", "ADAUSDT"
        ]
    },
    {
        "name": "settings[*].options.take_profit_long",
        "start": 0,
        "end": 10.0,
        "step": 0.5,
        "values": []
    }
]
Also, all bot strategies are available in PineScript format for backtesting on TradingView.