 hamster-bot
Backtesting is the process of testing a trading strategy on historical data. It lets traders evaluate how effective their strategy is and identify its strengths and weaknesses. Backtesting helps you understand how a strategy would perform under various market conditions and lets you optimize its parameters to achieve better results.
All the strategies listed below can be tested on historical data in the TradingView strategy tester.
 The bot has its own advanced built-in backtester that lets you correctly test entire trading systems and all the capabilities of the trading bot! Tester description: hamster-bot/bot/backtesting

Trade any idea and any strategy
Any of your strategies can be added to hamster-bot — just submit your request via the form or contact me directly
-
Here's how it works:
- You have an interesting strategy you'd like to trade in an automated way
- Submit a request via the form. Ideally you already have the strategy's Pine Script code
- Wait for a notification that the strategy has been added
- Trade fully automatically on your strategy with the bot
If you don't have a strategy but you have an idea — Great! Submit a request to have the idea reviewed and turned into a trading strategy, followed by testing the idea on historical data.
Trend strategies:
ZigZag, ZZ, ZZ-2, ZZ-6
The core idea of the strategy is to catch a strong trend move as early as possible and hold the position for the duration of the trend. A trade opens the moment price breaks pre-built levels based on past price highs/lows.
It's based on logic similar to the ZigZag indicator:
● When the market starts turning up, a local low is recorded
● When it turns down — a local high
These points become reference levels. They form the levels the market has to break to confirm the move.
Reversal-based (flip long ↔ short)
A position is always open and flips from short to long. (Unless various strategy modifiers are used)
⚠️ The strategy generates losing trades when the market is ranging and during V-shaped reversals.
Working order type: Market Stop order (on some exchanges this may also be called Conditional or Trigger order)
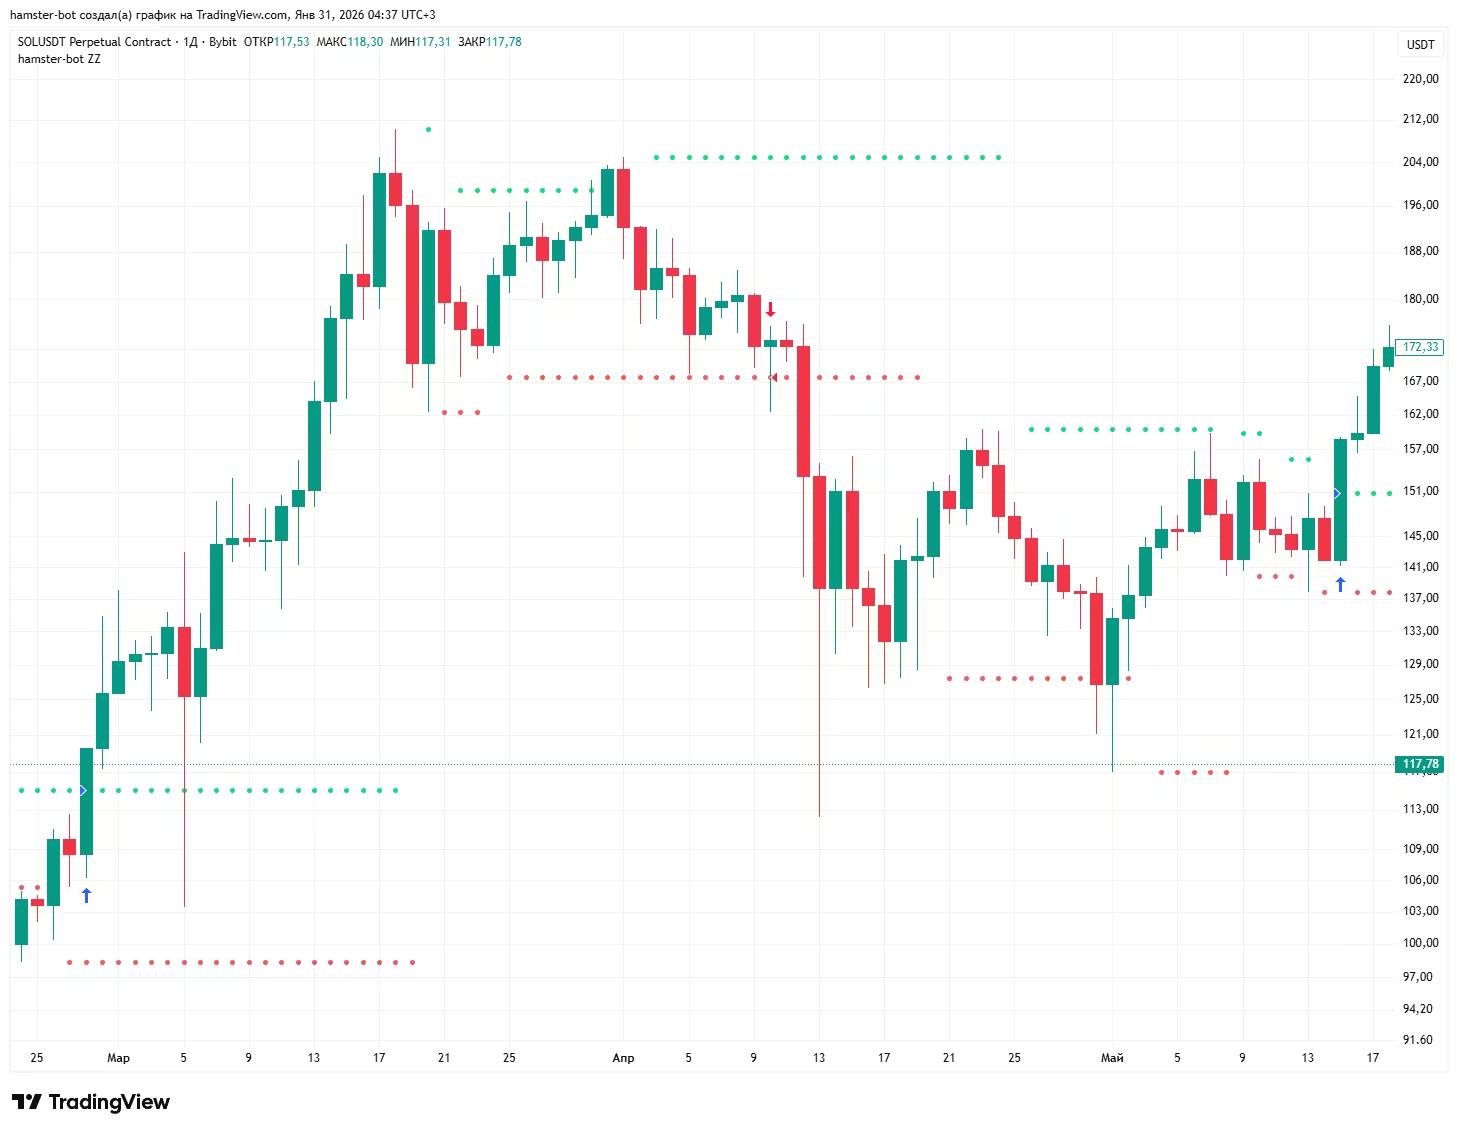
● Green marks where a conditional buy order is placed. Break of the last significant high.
● Red marks a sell. Price breaks the last low.
After the strategy starts, if there is no position and the price is between the levels, 1 order to open a long position and 1 for short will be placed. If the price is not between the levels, or there's an open position, only 1 order will be placed.
If a position is open, the strategy should have only 1 order. By default, the size of this order equals the position size * 2. To reverse the position (close and open a new one of the same size)
Backtest
Test in the built-in backtester
A Pine Script for testing the strategy on historical data in the TradingView strategy tester:
Recommendations:
(not strict, and can be broken for research purposes)
Working timeframe from 4h and up.
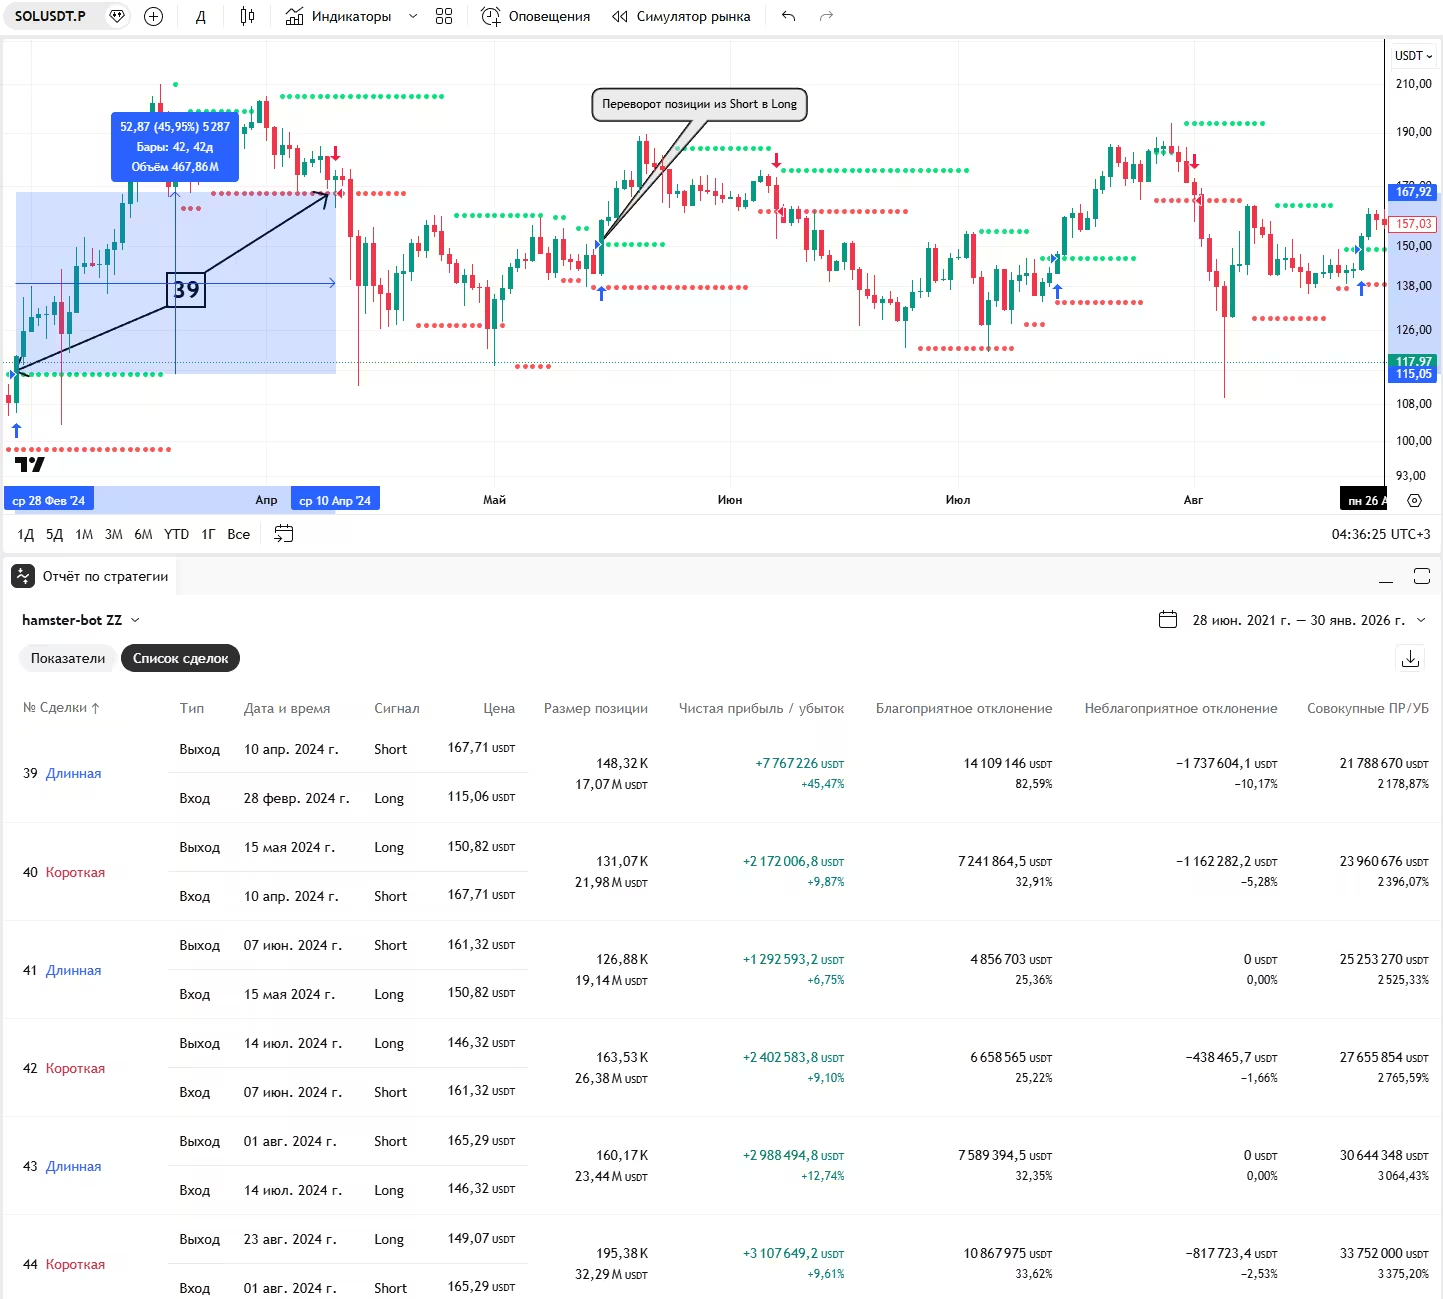
For the curious
The algorithm for building the levels of the ZZ2 strategy. It uses a non-standard ZigZag indicator. You can see from the code how simple it is, and repainting is excluded. But the levels are built with a delay of a few candles (this doesn't get in the strategy's way at all)

Three sequentially smoothed EMAs are used. This creates strong smoothing, reducing noise.
The variable z records the reversal points. If the EMA turns up → the local low (l) is taken. If it turns down → the local high (h). These points (l and h) become the basis for building the levels.
DoubleDragon (experimental stage)
This is still the same ZigZag strategy. But we work a little differently. The whole difference is in how we look at the backtest, using the ratio chart of two coins XXXUSDT/xxxusdt.
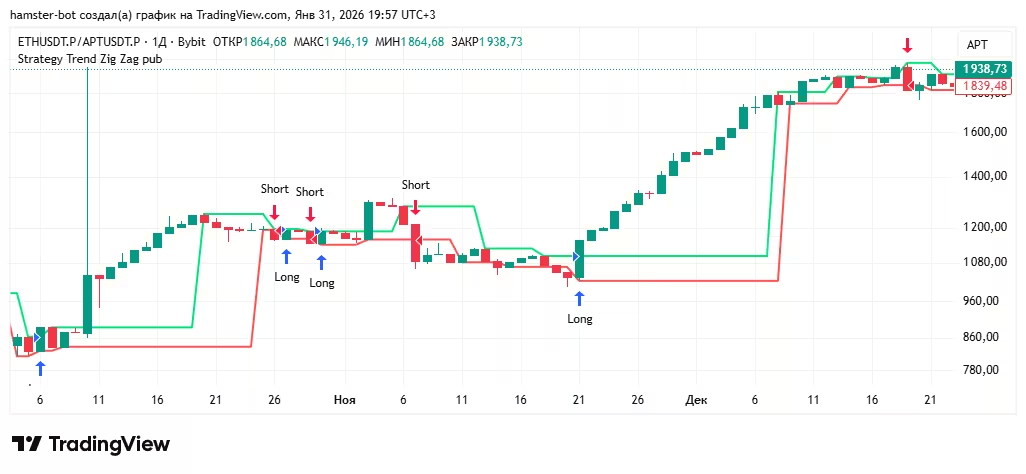
Wherever the synthetic chart in the strategy tester opens a Long position, on the real market a Long is opened on XXXUSDT and a Short on xxxusdt.
Wherever a Short position is opened, on the real market a Short is opened on XXXUSDT and a Long on xxxusdt.
Backtest
Test in the built-in backtester
A Pine Script for testing the strategy on historical data in the TradingView strategy tester:
But as the input in the strategy tester we choose a synthetic chart instead of a single trading pair.
A synthetic chart of the ratio BYBIT:XXXUSDT.P/BYBIT:xxxusdt.P (where XXX is any cryptocurrency with a price higher than xxx)
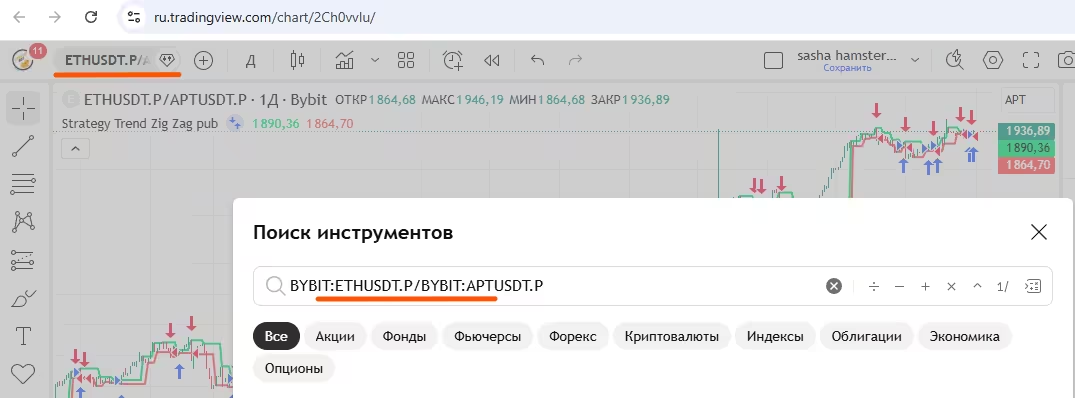
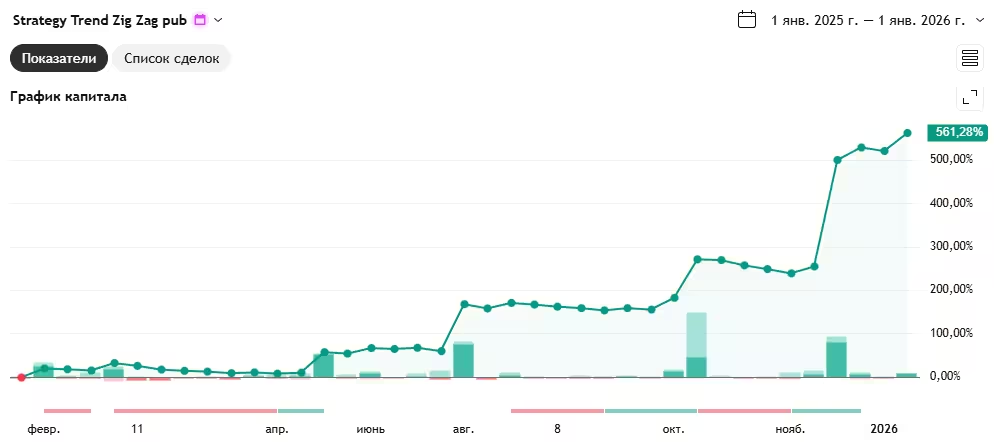
Strategy tester result for 2025 on BYBIT:ETHUSDT.P/BYBIT:APTUSDT.P on the 1d timeframe:
Counter-trend strategies:
Mean reversion | MRS strategy (Envelope, ShiftMA, MultiMA, Colorbox)
MRS - Mean Reversion Strategy. This is a counter-trend strategy that works on the assumption that price will return to its average value after deviating from it. The opening order is placed at an offset from the average price. The closing order is placed at the average price with no offset. On a sharp price deviation, a position opens and closes when the price returns to the average value.
Trades under the strategy are generated at moments when the price moves away from the average by a certain percentage. ⚠️ But if the price keeps moving in the same direction without a pullback, the position will be a loss. Price falls — the strategy buys (going against the trend). Price rises — it sells (also against the trend). But the close will happen sooner or later at the average price, in any case.
As a rule, positions under this strategy aren't held for long. And in a calm market you can stay out of a position for a long time.
Working order type: Limit. Placed in advance and moved as the average price changes.
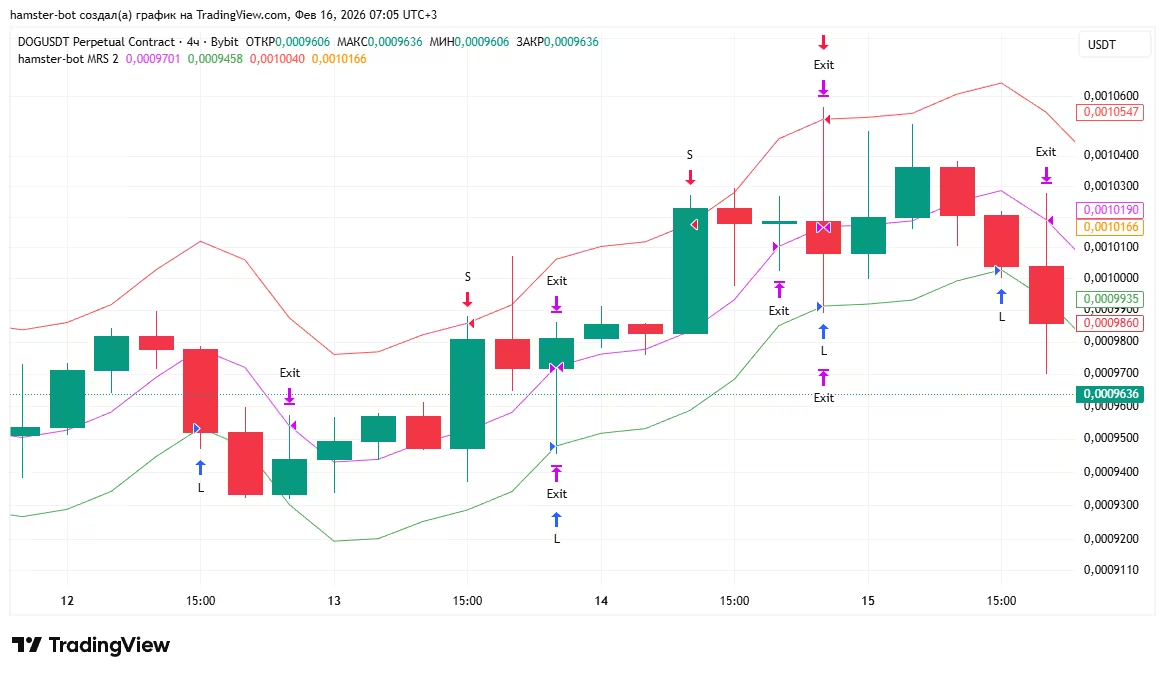
In the simplest implementation, the chart has three MA (moving average) lines.
● The base Fuchsia-colored MA shows the price of the closing limit order. No offset
● The Green Long MA - the price of the limit BUY order that opens the LONG position. It's the base MA simply offset down by a %.
● The Red Short MA - the price of the limit SELL order that opens the SHORT position. It's the base MA simply offset up by a %.
How it works: If both long and short are enabled, 2 orders are placed. If only long or short is enabled, 1 order. While waiting for a position, the orders move along their lines with each new candle. When the price reaches the price of our opening order, a position opens and a closing order is placed at the base MA. The closing order also moves along its MA until it's filled. Then the cycle repeats.
Backtest
Test in the built-in backtester
A Pine Script for testing the strategy on historical data in the TradingView strategy tester. It's a popular strategy and you can find many variations under different names.
-
Links:
- A simple version of the strategy with a minimal set of settings. I recommend starting to get familiar with the strategy using this script.
- A script with a larger set of parameters that can be reproduced in the trading bot.
- A script that lets you place multiple opening orders (increasing the position | averaging in).
You can configure this strategy very flexibly.
-
MA order settings:
- source -
open, high, low, close, hl2, hlc3, ohlc4, hlcc4, oc2 - type - moving average type
SMA, EMA, GMA, HARMONIC, TEMA, DEMA, ZLEMA, WMA, VWMA, RMA, EHMA, THMA, HMA, DMA, ATR, H, L - multiplier - offset. 1 means no offset, 0.99 is -1%, 1.01 is +1%
More on the cap on the number of open positions and placed orders, and other interesting options that can turn this strategy into ColorBox, is described right in the bot's interface.
To be continued...
HD, HiDeep
To be continued...
https://www.tradingview.com/script/U4rB07gZ-hamster-bot-HiDeep-strategy/
https://ru.tradingview.com/script/2DOR1p4V-hd-simple-v5/
This strategy emerged after a lot of thinking about improving the mean reversion | MRS | Envelope strategy, and those improvements led to a separate strategy.
Key fundamental differences from MRS:
● only works with a market order. The price at which the buy/sell will happen isn't known in advance, so nothing can be placed ahead of time
● all actions happen at candle close. This results in very simple, robust strategy logic that backtests very well even in primitive strategy testers
● a non-obvious consequence of the point above — significantly better survivability of the strategy during sharp moves within a single candle. Since nothing happens inside the candle, even if the candle makes an 80% price move.
● the strategy uses the MRS strategy's logic as one of the conditions (a filter) for triggering an order.
● unlimited number of averaging-in orders.
This is a counter-trend strategy that looks for moments of local oversold conditions and opens buys on pullbacks down, expecting a subsequent bounce.
It combines:
● filtering entries through a moving average (as in the strategy above — Mean Reversion | MRS)
● analysis of the price's deviation from the average
● a simple oversold model (similar to RSI). Price falls faster than usual.
● exit based on a sign of price recovery (mirror-opposite conditions to the buy)
The strategy tries to catch a situation where:
● Price has dropped sharply
● The move looks "overextended" (too strong relative to the norm)
● There are signs of short-term oversold conditions
At such moments it assumes the market has temporarily overshot to the downside and may bounce.
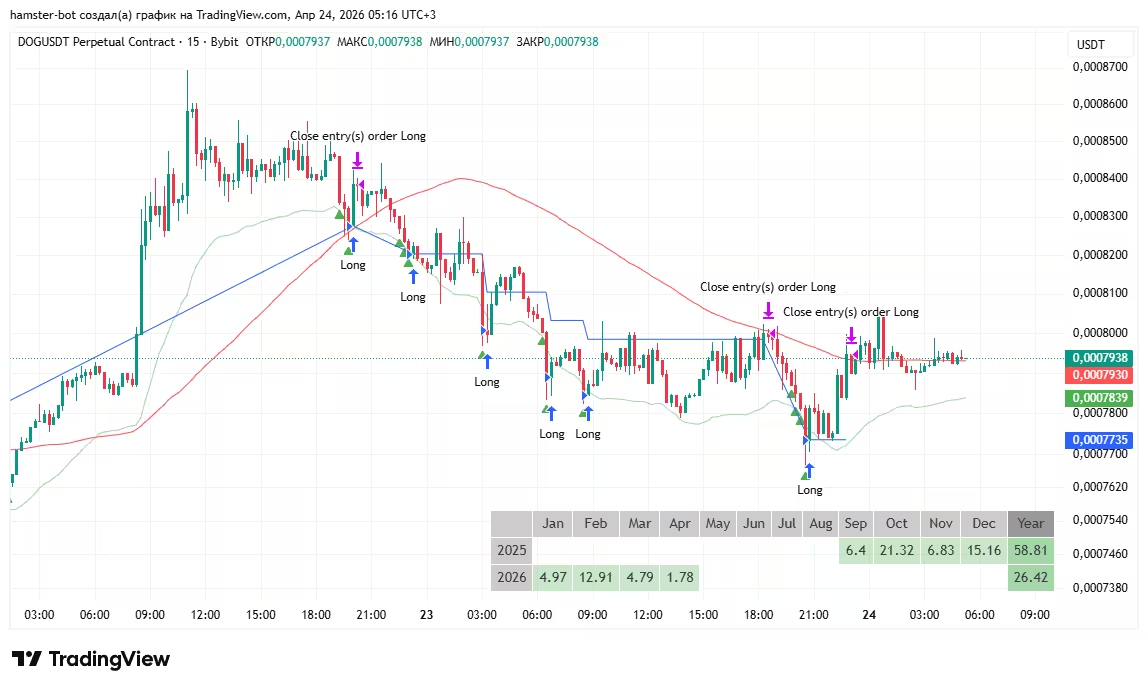
An example of a variation of the HiDeep strategy on the chart above.
Entering Long, and subsequent averaging-in, on candles that are:
● below the green trigger MA line with a downward offset
● marked with a green triangle ▲
The position is closed when High touches the red MA line. (action on candle close)
The blue line shows the average buy price.