 hamster-bot
HiDeep
To be continued...
https://www.tradingview.com/script/U4rB07gZ-hamster-bot-HiDeep-strategy/
https://ru.tradingview.com/script/2DOR1p4V-hd-simple-v5/
This strategy emerged after a lot of thinking about improving the mean reversion | MRS | Envelope strategy, and those improvements led to a separate strategy.
Key fundamental differences from MRS:
● only works with a market order. The price at which the buy/sell will happen isn't known in advance, so nothing can be placed ahead of time
● all actions happen at candle close. This results in very simple, robust strategy logic that backtests very well even in primitive strategy testers
● a non-obvious consequence of the point above — significantly better survivability of the strategy during sharp moves within a single candle. Since nothing happens inside the candle, even if the candle makes an 80% price move.
● the strategy uses the MRS strategy's logic as one of the conditions (a filter) for triggering an order.
● unlimited number of averaging-in orders.
This is a counter-trend strategy that looks for moments of local oversold conditions and opens buys on pullbacks down, expecting a subsequent bounce.
It combines:
● filtering entries through a moving average (as in the strategy above — Mean Reversion | MRS)
● analysis of the price's deviation from the average
● a simple oversold model (similar to RSI). Price falls faster than usual.
● exit based on a sign of price recovery (mirror-opposite conditions to the buy)
The strategy tries to catch a situation where:
● Price has dropped sharply
● The move looks "overextended" (too strong relative to the norm)
● There are signs of short-term oversold conditions
At such moments it assumes the market has temporarily overshot to the downside and may bounce.
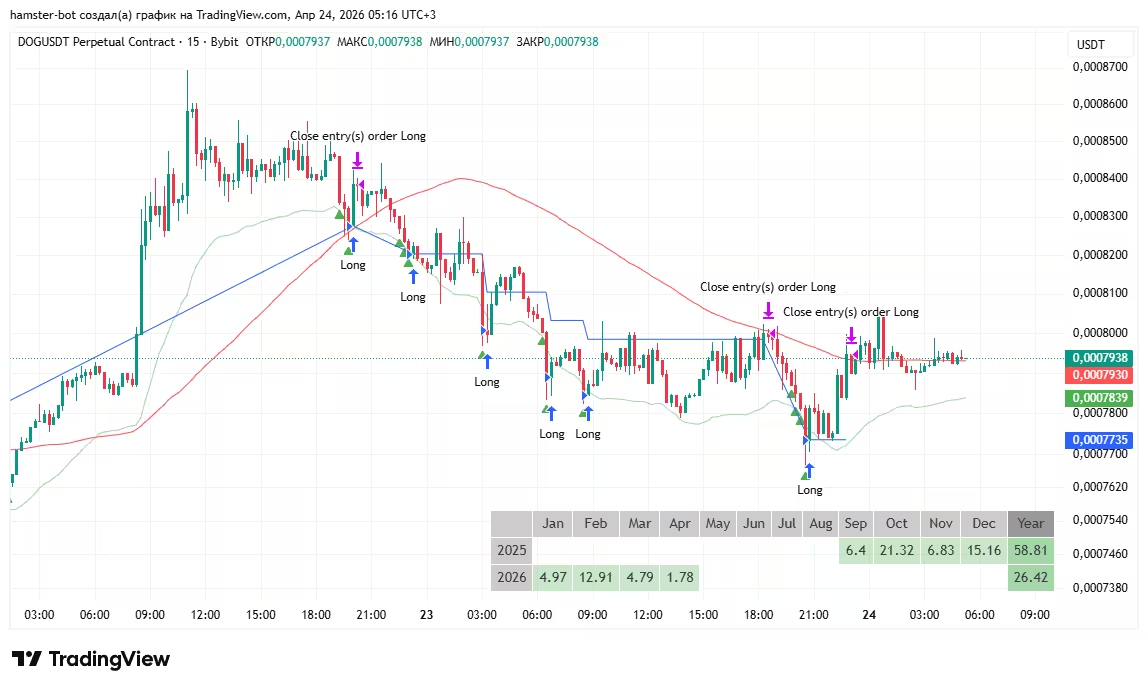
An example of a variation of the HiDeep strategy on the chart above.
Entering Long, and subsequent averaging-in, on candles that are:
● below the green trigger MA line with a downward offset
● marked with a green triangle ▲
The position is closed when High touches the red MA line. (action on candle close)
The blue line shows the average buy price.
Backtest the strategy on historical data in the tester and run it in hamster-bot.